


Bitcoin vs. Nasdaq: waiting for another breakdown

Why BTC’s correlation with stock indices is dangerous
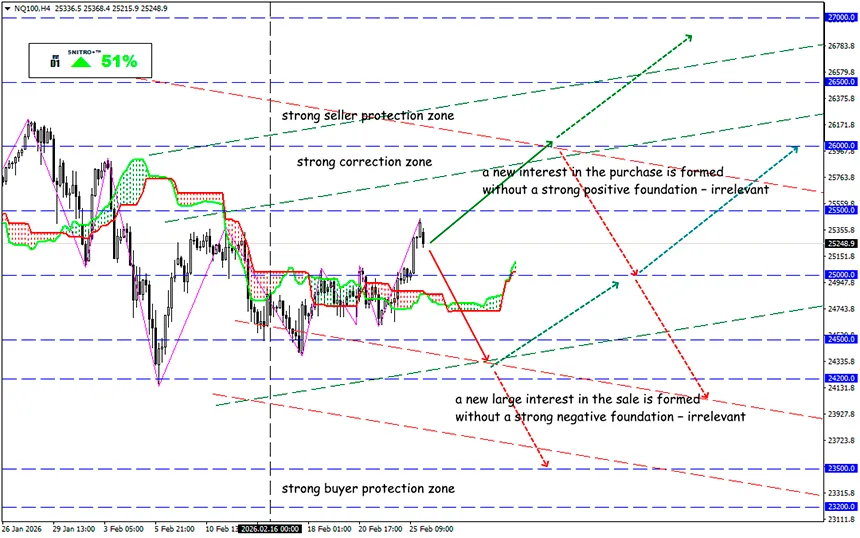
NQ100
Key zone: 25,000-25,500
Buy: 25,800(on a confident breakout of 25,500); target 26,500-27,200; StopLoss 25,200
Sell: 25,000(on strong negative fundamentals); target 24,200-23,500; StopLoss 25,500
A widely shared view is forming in the crypto market that if a large-scale correction hits the stock market, BTC could fall to $50,000 and potentially further to $35,000. Bitcoin’s correlation with equities has returned to levels last seen in 2022.
One of the key conditions for major growth in digital gold and altcoins has always been their independence from traditional financial markets, but that principle is no longer working. According to statistics, since around 2019, Bitcoin has been perceived not as a purely speculative digital asset, but more like leveraged technology stocks.
Reminder:
The correlation between Bitcoin and stock indices (such as the S&P 500 or Nasdaq) is a critical issue for investors, as it determines whether BTC serves as a diversification tool or simply another risk asset moving alongside equities. In recent years, the relationship between crypto and traditional markets has shifted significantly—from near-complete independence to periods of strong synchronization.
The current period is characterized by high but unstable correlation.
- BTC’s correlation with the S&P 500 is about 0.28 in 2026 — lower than many traditional assets, but still meaningful
- Correlation with individual tech stocks (for example, Nvidia) has reached 0.75
- The correlation between BTC’s 90-day volatility and the VIX index reached 0.88, indicating a strong connection to equity market risk
Bitcoin’s realized capitalization has fallen from its November peak of $1.12 trillion to $1.09 trillion. Over the past month, the metric declined by 2.26%, reflecting ongoing capital outflows.
The largest share of Bitcoin supply (25.9%) consists of coins that have remained inactive for three to six months. Most of these positions were opened near price highs and are currently at significant losses.
Large investors are avoiding mass capitulation, but there is still no inflow of new capital to drive prices higher.
Outflows from Bitcoin ETFs have continued for the fourth consecutive month.
It is commonly believed that Bitcoin follows the S&P 500. Digital assets tend to rise during periods of low Federal Reserve interest rates and decline when rates increase.
However, over the past six months, this relationship has broken down. Since late August, gold has risen 51%, the S&P 500 has gained 7%, while Bitcoin has dropped 43%.
Monetary easing would create conditions for a rapid upward move. Digital gold would gain room for growth and narrow the gap with stock indices.
So what does this mean?
Bitcoin can no longer be considered fully independent—it has become part of the global financial system. Current BTC price dynamics are closely correlated with the Nasdaq 100 index. At the same time, the crypto market acts as a volatility catalyst for traditional finance.
Price history shows that during bear markets, Bitcoin drawdowns were 2–4 times deeper than Nasdaq declines. However, this gap is gradually narrowing due to the arrival of institutional investors.
Bitcoin is now much closer to Nasdaq than to gold and correlates more often with tech stocks than with defensive assets. This means that if Nasdaq enters a typical 20–23% correction, BTC could fall an additional 25–40% from current levels. The probability of such a scenario is estimated at 20–25%.
Around 150 days have passed since Bitcoin’s ATH—this is not enough time to form a definitive price bottom. Historically, transitioning to a new long-term growth phase takes about 250 days or more. Therefore, it may be wise to wait before buying. Success in the crypto market belongs to patient investors, not those trying to catch the perfect entry point.
So we act wisely and avoid unnecessary risks.
Profits to y’all!


