



Who is hiding the real crisis in U.S. stocks?
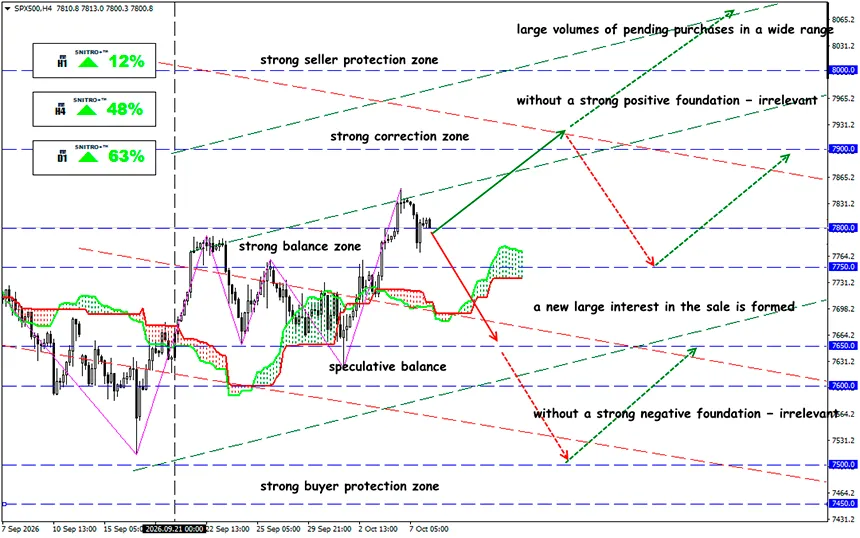
S&P 500 at record highs, but 50% of the market is under pressure
SP500
Key zone: 7,750 - 7,850
Buy: 7,900 (on a confirmed breakout at 7,850); target 8,100; StopLoss 7,840
Sell: 7,750 (on strong negative fundamentals); target 7,550; StopLoss 7,810
An illusion of strength: the U.S. market is showing a dangerous divergence — the S&P 500 is setting new records while hundreds of companies are losing market capitalization. Rising Treasury yields are adding to the pressure.
The S&P 500 is failing to fulfill its role as a stock market indicator.
A reminder:
At the close of trading on October 7, the S&P 500 fell 0.22% to 7,801.77 points. A day earlier, the index had set a record closing high of approximately 7,819 points. Thus, after a minor correction, it was just 0.22% below its record closing level.
At the same time:
- More than 40% of S&P 500 stocks were trading at least 20% below their 52-week highs.
- 212 companies were in individual bear-market territory.
- 17 companies had lost more than half their value relative to their highs.
- Over the previous 12 months, the index had gained 15.3%, and it was up 12.2% year to date.
The index remains in an uptrend, but participation by individual companies in that advance is declining. The main risk is not the decline in individual stocks itself, but the market's growing dependence on a limited number of its largest constituents.
The reason for the divergence between the index and most stocks lies in the S&P 500's calculation methodology. Each company's weight is determined by its float-adjusted market capitalization.
The math illustrates the scale of the problem. If a stock with an 8.4% index weight rises by 10%, its direct contribution to the index's return will be approximately 0.84 percentage points, assuming all other constituents remain unchanged. This means gains in a handful of technology giants can offset declines in dozens or even hundreds of smaller-cap companies.
New S&P 500 highs can no longer automatically be interpreted as confirmation of sustainable growth across the entire U.S. stock market. Assessing the quality of the trend requires examining market breadth.
To assess future market performance, traders should monitor four interconnected indicators:
- S&P 500 Equal Weight / S&P 500: a sustained increase in the ratio would confirm that the market rally is broadening.
- Percentage of stocks above their 200-day moving averages: an increase would indicate a recovery in medium-term trends across a larger number of companies.
- 10-year Treasury yield: stabilization or a decline from current elevated levels could support market segments most sensitive to interest rates.
- Ratio of new 52-week highs to new 52-week lows: an improving balance would provide additional confirmation that selling pressure is easing.
Three possible scenarios emerge:
- Broadening rally — positive scenario. Falling Treasury yields and strong corporate earnings bring buyers back into financials, industrials, consumer sectors, and other lagging segments. The S&P 500 continues to advance, while its underlying structure becomes more resilient.
- Continued concentration — base-case scenario. Technology giants keep the index near record highs while much of the market remains under pressure. Under these conditions, active stock selection may become more important than passively tracking the index.
- Correction in market leaders — negative scenario. Deteriorating earnings expectations for technology companies or another spike in Treasury yields triggers a selloff in the largest constituents. Because of the index's high concentration, their declines quickly spread across the entire S&P 500.
So What Is the Bottom Line?
The market is strong by capitalization but weak in its underlying structure. The current situation does not mean an S&P 500 crash is inevitable. The largest technology companies retain strong competitive positions, while investment in AI infrastructure continues to support expectations for corporate earnings growth.
It would be inappropriate to assign probabilities to the scenarios above without a quantitative model. As long as the index remains near record highs thanks to a limited number of leaders, a broad-market buying strategy will be risky. Priority should be given to risk management, analysis of individual stocks' relative strength, and confirmation of price moves through market breadth.
The next stage of the S&P 500 rally will require not only new highs in Nvidia and other technology giants, but also the return of buyers to hundreds of companies that have so far remained on the sidelines of the rally.
So we act wisely and avoid unnecessary risks.
Profits to y’all!


