



Wall Street searches for a fresh bottom

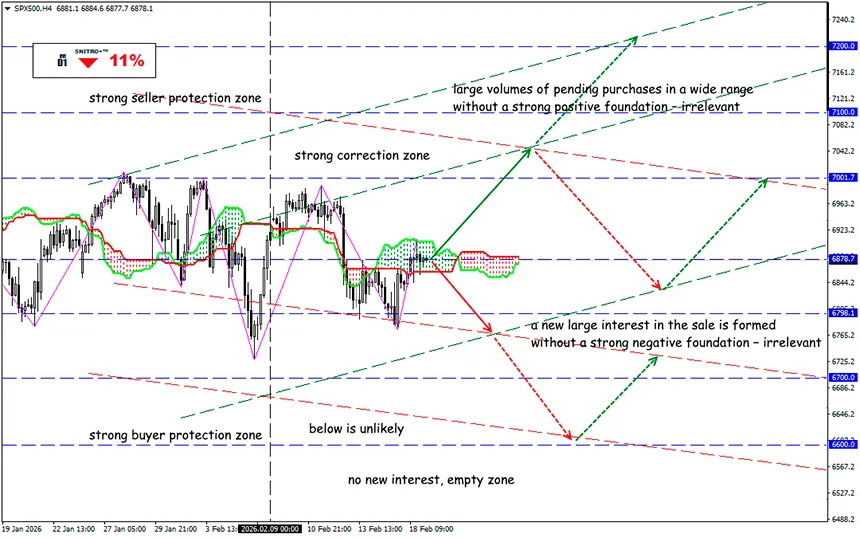
S&P 500 re-tests critical support
SP500
Key zone: 6,800 - 6,900
Buy: 6,950 (after retesting the 6,850 level); target 7,100; StopLoss 6,900
Sell: 6,800(on strong negative fundamentals); target 6,650; StopLoss 6,850
Major market players and Wall Street analysts are trying to assess how far the S&P 500 index could decline. The index is testing a support level that has held for several months.
After the record weekly drop in the S&P 500 last November, estimating the depth of the current decline below the 100-day moving average is technically challenging and nearly impossible from a fundamental perspective.
After the record weekly drop in the S&P 500 last November, estimating the depth of the current decline below the 100-day moving average is technically challenging and nearly impossible from a fundamental perspective.
The most likely explanation appears to be that investors are reallocating funds from overvalued technology stocks into more defensive market segments. Nevertheless, on Tuesday stocks showed sharp volatility, recovering part of their initial losses and closing with a slight gain.
We are observing a standoff between bullish and bearish forces, confined within a defined range.
- Market sentiment is largely pessimistic, yet globally investors are still reluctant to engage in broad selling.
- The index is currently showing signs of market pressure, trading in a narrow range between 6,800 and just under 7,000 points. Investors have reduced their equity exposure to the lowest level since July, according to a survey of active fund managers conducted by the National Association of Active Investment Managers.
- These price swings are prompting strategists and technical analysts to closely examine charts to identify the next support levels.
- The advance of the S&P 500 is being restrained by weak performance among its largest constituents. The “Magnificent Seven” stocks have declined about 7% in 2026, with Amazon.com Inc. and Microsoft Corp. posting double-digit losses. This group continues to form a peak and is weighing on the S&P 500.
Wall Street analysts are closely monitoring the number of companies reaching new highs, which is considered a sign of a sustained bullish trend. A recent report from Roth Capital Partners noted that 15% of companies in the Russell 3000 index hit new highs, while only 8% fell to new lows, despite concerns related to artificial intelligence that have affected other sectors.
At the same time, a significant divergence in the number of companies reaching new highs may signal trend exhaustion and a potential reversal.
Last week, the New York Stock Exchange recorded a record number of new 52-week highs — 263 companies. However, in January, when the S&P 500 set a new all-time high, there were only 109 such companies. We should closely monitor further developments and await new signals of a possible index decline, so reviewing corporate earnings reports is mandatory for everyone, regardless of what you trade.
At the moment, the 6,720-point zone appears to be major support. This level will help determine whether market rotation continues or whether its strength is beginning to fade. A decisive break below this level would signal the end of the medium-term bullish trend.
So we act wisely and avoid unnecessary risks.
Profits to y’all!


