



Tradition: profit risk from may selling
Why you may have to sell in may
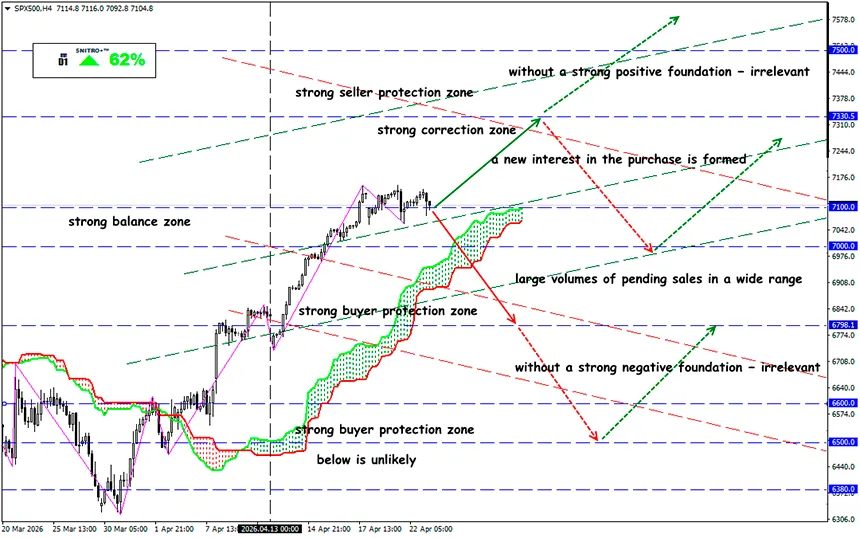
SP500
Key zone: 7,000 - 7,200
Buy: 7,150 (on strong positive fundamentals); target 7,300-7,350; StopLoss 7,080
Sell: 6,950 (on a decisive break above 7,000); target 6,750-6,700; StopLoss 7,020
The S&P 500 index closed at a record level of 7041 on April 17, 2026, just weeks after a roughly 10% decline driven by concerns over the war in Iran. This rally is taking place against the backdrop of the well-known seasonal warning: “Sell in May and go away.”
Recall:
The average performance of the S&P 500 from November to April is +7.2%, while from May to October it does not exceed 2.3%. This pattern is real, but it is a very “fragile” substance.
Four out of the five largest daily jumps in the S&P 500 this year occurred during the war period, while the capitalization of the “Magnificent Seven” increased by $2.5 trillion in eight days.
Typically, returns from May to October are mildly positive, but this year there are three specific risks:
- an oil shock that has not yet fully ended;
- overvaluation of equities and margin debt near historical highs;
- a “thriller” around the replacement of the Fed leadership.
Markets have a documented history of “testing” new Fed chairs. For example, under Powell, the S&P 500 fell nearly 20% at the end of 2018 after hawkish comments, while Alan Greenspan faced the 1987 crash shortly after taking office.
It is widely expected that the Fed under Warsh will be more hawkish on inflation, but less accommodating regarding labor market weakness.
The current rally was not initiated by optimists, but by hedge funds closing short positions; the momentum was picked up by trend-following strategies, and then retail investors joined in.
This means we are facing not just panic sell-offs, but also the need to reduce risk ahead of the summer market lull.
The current Middle East conflict fits into this narrative. Although prices declined from peak levels after the recent ceasefire, a sustained oil price above $100 directly leads to higher inflation, which in turn deprives the Fed of the ability to cut rates. According to Goldman Sachs’ “bearish” scenario, under such conditions the S&P 500 could fall to 5400, approximately 23% below current levels.
Even if the scenario does not fully materialize, the inflation impulse driven by rising energy prices narrows the room for growth in the second half of the year.
The April rally brought the S&P 500 back to record highs, but did not resolve the issue of properly assessing the quality of this move. The forward P/E currently stands at 20.9x, above both the 5-year average (19.9x) and the 10-year average (18.9x). The market is pricing in continued high earnings growth.
But there is a problem. Currently, the top 10 stocks account for 39% of the S&P 500’s market capitalization and 31% of its earnings. When a handful of mega-cap stocks determine both price and profit, a single earnings miss from companies like NVIDIA or Microsoft can impact the entire index.
And what is the result?
Emotions and market crowd behavior now influence prices more strongly and faster than fundamentals. On Wall Street, TACO trades (Trump Always Chickens Out) are actively used — the market believes that Trump will always back down once equities fall significantly, effectively making the market itself a constraint for the White House.
JPMorgan experts have raised their year-end 2026 S&P 500 target from 7200 to 7600 points, implying about 7% upside from current levels.
The key risk is that prices are increasingly detached from reality. Tankers are barely passing through Hormuz, global oil inventories are declining, and geopolitics remains unresolved. Yet the market trades on sentiment rather than data.
In the medium term, long positions in gold futures should be considered, along with cautious speculation in crude oil futures, as both may benefit if geopolitical stress and inflation hedging remain elevated
So we act wisely and avoid unnecessary risks.
Profits to y’all!


